
Every day, the Indian stock market reacts to a hidden language. It is not just about company profits or stock charts. It is about the broader financial world. This world is driven by trading economics.
When the Reserve Bank of India (RBI) changes interest rates, the Nifty 50 moves. When global oil prices jump, the Indian Rupee reacts. If you want to succeed in the financial markets, you must understand these macroeconomic forces.
This guide breaks down everything you need to know about trading economics. You will learn how to read data, predict market movements, and trade smarter in the Indian market.
What is Trading Economics?
Trading economics is the practice of using macroeconomic data to make financial trading decisions. Instead of looking only at a specific company’s balance sheet, you look at the entire country’s financial health.
Economics and trading are tightly connected. A strong economy usually means a strong stock market. A weak economy often points to falling stock prices. By tracking economic indicators, traders can predict the future direction of stocks, currencies, and commodities.
The Core Concept Explained
Think of the economy as a giant machine. The gears are different sectors like manufacturing, banking, and retail. Macroeconomic data acts as the dashboard that tells you how fast the machine is running.
If the dashboard shows that inflation is rising too fast, the machine might overheat. To cool it down, the central bank will raise interest rates. This action slows down borrowing and spending. As a result, company profits might fall, and stock prices usually drop. Trading economics is all about anticipating these chain reactions.
Why Indian Traders Need Macro Data
India is one of the fastest-growing major economies in the world. However, the Indian market is highly sensitive to both local and global data.
Many retail traders fail because they only look at technical charts. They buy a breakout on a chart, only to see the stock crash the next day because of a bad inflation report.
By mastering trading economics, you gain a massive advantage. You will know exactly why the market is moving. You will stop guessing and start making informed decisions based on hard facts. Furthermore, this knowledge helps you protect your capital during economic downturns.
Key Economic Indicators Every Indian Trader Must Watch
To apply trading economics in India, you must track specific data points. Here are the most critical economic indicators that move the BSE Sensex and NSE Nifty.
RBI Repo Rate and Monetary Policy
The Reserve Bank of India (RBI) controls the country’s money supply. The most important tool they use is the Repo Rate. This is the interest rate at which the RBI lends money to commercial banks.
- When the Repo Rate increases: Bank loans become expensive. People buy fewer homes and cars. Companies delay expansion plans. This usually causes stock markets to fall. Auto and real estate stocks are hit the hardest.
- When the Repo Rate decreases: Borrowing becomes cheaper. Consumer spending rises. Businesses expand easily. This usually pushes the stock market higher. Nifty Bank and infrastructure stocks often rally.
Inflation (CPI & WPI)
Inflation measures how fast prices are rising. India tracks two main types: Consumer Price Index (CPI) and Wholesale Price Index (WPI).
- CPI (Retail Inflation): This measures the price of goods bought by common people. If CPI is high, the RBI is likely to raise interest rates to control prices. High inflation hurts Fast Moving Consumer Goods (FMCG) companies because raw material costs go up.
- WPI (Wholesale Inflation): This measures the price of goods at the factory gate. It gives an early warning about future retail inflation.
Gross Domestic Product (GDP)
GDP is the total value of all goods and services produced in India. It is the ultimate scorecard of economic health.
- Strong GDP Growth: Shows a booming economy. Foreign Institutional Investors (FIIs) bring more money into India. The Nifty and Sensex usually hit new highs.
- Weak GDP Growth: Indicates a slowdown. Investors pull their money out, leading to a bearish market trend.
Employment and PMI Data
While India does not have a single monthly jobs report like the US, traders watch other high-frequency indicators.
- Purchasing Managers’ Index (PMI): This is a survey of business managers in the manufacturing and services sectors. A PMI above 50 means the sector is expanding. A reading below 50 means it is shrinking.
- Unemployment Rate: High unemployment means lower consumer spending. This hurts retail, auto, and consumer durable stocks.
How to Use an Economic Calendar for Trading
An economic calendar is a schedule of upcoming data releases. It shows you exactly when reports like GDP, CPI, or RBI meetings will happen. Every professional trader uses one.
Timing Your Trades
Data releases create massive volatility. If you are a day trader, you need to know exactly when the data comes out.
For example, the RBI usually announces its monetary policy decisions at 10:00 AM IST. In the minutes leading up to the announcement, the market is usually quiet. The second the rate is announced, the Nifty Bank index can swing hundreds of points.
Managing Volatility: Forecast vs. Actual
The secret to trading economics is understanding expectations. The market does not just react to the data itself; it reacts to how the data compares to the forecast.
- Forecast (Consensus): What experts think the number will be.
- Actual: The real number released by the government.
If the market expects India’s GDP to grow by 6.5%, that expectation is already “priced in” to the stock market.
- If the actual GDP comes in at 6.5%, the market might not move much.
- If the actual GDP comes in at 7.2%, the market will likely surge upward.
- If the actual GDP comes in at 5.8%, the market will likely crash.
Trading Economics vs. Technical Analysis
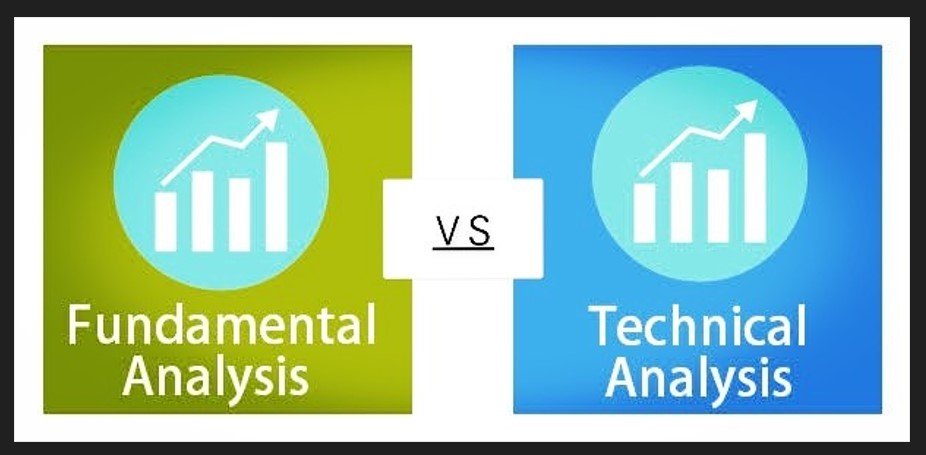
Many traders wonder if they should use economic data (fundamental analysis) or stock charts (technical analysis). The best approach is to use both. Here is how they compare.
| Feature | Trading Economics (Macro) | Technical Analysis |
| Focus | Economic health, data, policies | Price action, charts, volume |
| Time Horizon | Medium to Long-term | Short to Medium-term |
| Tools Used | Economic calendars, GDP reports | Candlesticks, RSI, Moving Averages |
| Main Goal | Finding the Why (Market direction) | Finding the When (Entry/Exit points) |
| Strengths | Predicts long-term trends accurately | Perfect for precise entry and exit timing |
Pro Tip: Use trading economics to decide what to trade (e.g., buying banking stocks because interest rates are falling). Use technical analysis to decide when to buy them (e.g., waiting for a breakout above a resistance line).
The Impact of Global Economics on Indian Markets
India does not operate in a bubble. Global economic forces heavily influence Dalal Street. You cannot master trading economics without watching international data.
US Federal Reserve (The Fed) Decisions
The United States has the biggest economy in the world. The US central bank is called the Federal Reserve.
When the Fed raises interest rates in America, global investors pull their money out of emerging markets like India. They do this because they can get better, safer returns in the US. This causes the Indian Rupee to fall and the stock market to drop. Always track US inflation and Fed meetings.
Crude Oil Prices
India imports more than 80% of its crude oil requirements. Because of this, global oil prices are a crucial economic indicator for Indian traders.
- Rising Oil Prices: Bad news for India. It increases the country’s import bill and causes high inflation. Companies that use a lot of oil, like airlines (IndiGo) and paint companies (Asian Paints), see their profits drop.
- Falling Oil Prices: Good news for India. Inflation cools down. Paint, aviation, and tyre manufacturing stocks generally see a strong uptrend.
Foreign Institutional Investors (FIIs)
FIIs are large global funds that invest in India. They track global trading economics closely. If global liquidity is high (lots of free money in the system), FIIs pump billions of dollars into Indian equities. Tracking FII daily buying and selling data is essential for understanding market momentum.
Pros and Cons of Macro Trading

Like any strategy, trading based on economic data has its strengths and weaknesses.
Pros:
- Provides Real Logic: You are not just guessing based on lines on a chart. You understand the actual financial machinery driving the prices.
- Helps Avoid Crashes: By watching inflation and interest rates, you can see economic slowdowns months before they happen.
- High Profit Potential: Big economic surprises create massive, fast market moves. Traders who correctly predict these moves can make significant profits.
- Sector Rotation: Macro data tells you exactly which sectors to buy and which to avoid at different stages of the economic cycle.
Cons:
- Information Overload: There is a massive amount of data released globally every week. It can easily overwhelm a beginner.
- Market Irrationality: Sometimes, the market ignores bad economic data and keeps going up. “The market can stay irrational longer than you can stay solvent.”
- Delayed Reactions: Economic data looks at the past (e.g., last month’s inflation). Markets often look to the future.
Actionable Steps to Master Trading Economics
Ready to apply trading economics to your portfolio? Follow this step-by-step framework to get started in the Indian market.
Step 1: Follow Reliable Data Sources
Stop relying on social media rumors. Start checking official data. Use free economic calendars available on financial websites. Track the official press releases from the RBI website and the Ministry of Statistics.
Step 2: Correlate Data with Nifty and Sensex
Do a historical study. Open a chart of the Nifty 50. Look back at dates when the RBI hiked interest rates suddenly. What happened to the chart? Look at dates when GDP growth shocked the market. Seeing the historical reaction will train your brain to anticipate future moves.
Step 3: Understand Sector Sensitivities
Create a cheat sheet for how different data affects different sectors.
- Falling Interest Rates: Buy Auto, Real Estate, Banking.
- Falling Crude Oil: Buy Paints, Aviation, Tyres.
- Weak Indian Rupee: Buy IT (TCS, Infosys) and Pharma. (They earn in dollars, so a weak Rupee boosts their profits).
Step 4: Practice Risk Management
Never bet your entire account on a single data release. Sometimes, data comes out positive, but the market drops anyway because big players are booking profits. Always use a stop-loss order to protect your capital from extreme volatility.
Frequently Asked Questions (FAQs)
1. What is the best economic indicator for stock trading in India?
There is no single “best” indicator, but the RBI Repo Rate and CPI Inflation are the most powerful drivers of the Indian stock market. Interest rates directly dictate the flow of money into equities.
2. How does the US Dollar index (DXY) affect the Indian share market?
The DXY measures the strength of the US Dollar against other currencies. Usually, there is an inverse relationship. When the DXY goes up (strong dollar), emerging markets like India usually fall because foreign investors pull their money out.
3. What is an economic calendar and where can I find one?
An economic calendar tracks the dates and times of government data releases. You can find free economic calendars on financial websites like Investing.com, Moneycontrol, and Trading Economics.
4. Why did the market fall even when the GDP data was good?
This happens due to “pricing in.” If the market expected a 8% GDP growth, and the actual result was 7.5%, the market will fall. Even though 7.5% is objectively good, it missed the market’s high expectations.
5. How does inflation impact my stock portfolio?
Moderate inflation is fine. However, high inflation eats into corporate profit margins because raw materials become expensive. It also forces the central bank to raise interest rates, which usually brings stock prices down.
6. Can I use trading economics for Intraday trading?
Yes, but it requires high skill. Intraday traders use economic data releases to capture sudden, volatile spikes in price. However, you must be very fast to execute trades the second the data drops.
7. Which Indian sectors benefit from a weak Rupee?
The Information Technology (IT) and Pharmaceutical sectors are the biggest beneficiaries. Companies like Infosys, TCS, and Sun Pharma export services and goods to the US. They get paid in Dollars. When they convert those Dollars to a weaker Rupee, their profits automatically increase.
8. What does “hawkish” and “dovish” mean in monetary policy?
A hawkish central bank is worried about inflation and wants to raise interest rates (bearish for stocks). A dovish central bank is worried about economic growth and wants to lower interest rates (bullish for stocks).
9. How do FIIs and DIIs use macroeconomic data?
Foreign Institutional Investors (FIIs) and Domestic Institutional Investors (DIIs) manage thousands of crores. They cannot trade based on short-term chart patterns. They base their massive investments entirely on macroeconomic data, GDP projections, and interest rate cycles.
10. Is technical analysis useless if I know trading economics?
Absolutely not. Trading economics tells you what asset to buy based on the economy’s health. Technical analysis tells you the exact price level and time to enter the trade. Combining both makes you a complete trader.
Conclusion
Mastering trading economics transforms you from a gambler into an educated investor. When you understand how GDP, inflation, crude oil, and RBI policies interact, the Indian stock market stops looking like a casino. It starts looking like a logical, cause-and-effect machine.
Start small. Bookmark a reliable economic calendar. Track the next RBI policy meeting and watch how the Nifty Bank index reacts. Memorize how sectors respond to falling oil prices or a weak Rupee.
By combining macroeconomic insights with strict risk management, you can confidently navigate the ups and downs of Dalal Street. The data is out there, published for free every single week. Use it, analyze it, and let trading economics guide your path to financial success.